A visual representation of a mix is a form of representing a mix in writing, similar to a model that clearly illustrates the stereo position of each instrument in a track and the frequency range it covers. This model allows us to know the frequency of each instrument, which can be used to analyze frequency conflicts between instruments to ensure that the various frequency bands of the entire song are not blurred due to conflicts between instruments. At the same time, this model can also help us understand Pan’s problem. In most cases, this mix image should tend to be symmetrical. If you find that the position of certain instruments is biased to one side, causing one side to sound slightly bloated, then use Panning to adjust the sound of each instrument. position to achieve a balanced state. In addition, some mixing techniques can also be presented on this image, because this image can not only show the status of the left and right channels, but also the far and near status in the stereo. As we all know, by adjusting the volume, you can adjust the distance of the instrument in the stereo in the most basic way. Similarly, adjusting the Reverb or Delay can also determine the front-to-back distance of the instrument, and this can also be shown in the visual way of presenting the mixing image. We can use the image to determine the current mixing state.
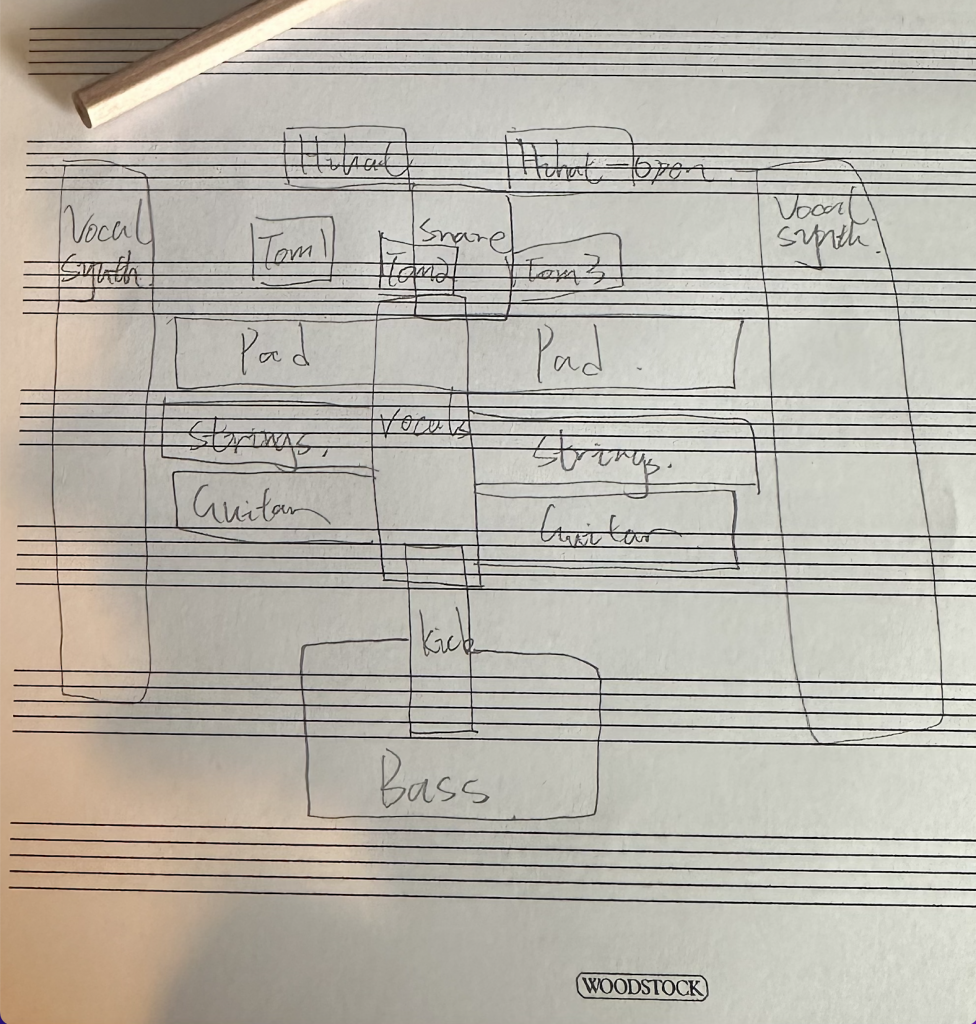
“Nobody’s home” by Avril Lavigne analysis
Overall, visualizing the mix gives me a clear idea of what the sound is going to be like throughout the track, and it’s like building a physical model to help us understand the mix. Not only can this be used to analyze mixing techniques in reference tracks, but you can also recognize problems with your own tracks, which is a very helpful form of learning to mix.